

Interactive charts, drag-and-drop widgets, and real-time filtering — learn how iProDash gives contractors the data visibility they need to grow profitably.
*Keywords: CRM for contractors | CRM for home services | field service CRM | home services CRM | contractor CRM software*
Why Most Contractors Are Flying Blind
Here's an uncomfortable truth about the home services industry: most contractors make business decisions based on gut feeling rather than data. They don't know their true profit margins by job type. They can't tell you which marketing channel delivers the highest-value customers. They have no idea which technician generates the most revenue — or which one has the highest cancellation rate.
This isn't because contractors don't care about data. It's because the tools available to them haven't made data accessible. Traditional CRM systems bury analytics behind complex dashboards and reports that require a data analyst to interpret. Spreadsheets can technically track anything, but they require manual data entry and custom formula creation that most busy contractors don't have time for.
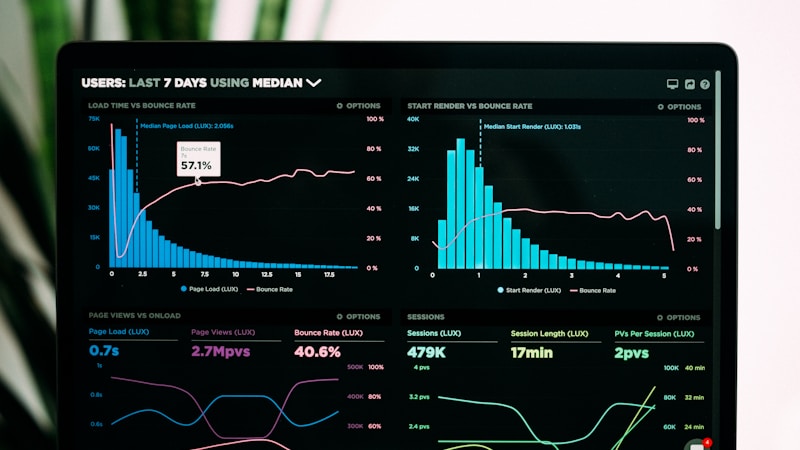
iProDash CRM takes a different approach. The analytics dashboard is the first thing you see when you log in. It presents your most important business metrics in clear, visual, interactive charts that require zero setup and zero technical knowledge. If you can read a bar chart, you can use iProDash analytics.
For contractors, HVAC companies, plumbers, electricians, and other home services businesses, this data visibility is the difference between growing strategically and just staying busy. Busy isn't the same as profitable, and growth without direction often leads to problems.
Six Interactive Widgets That Tell Your Business Story
The iProDash dashboard features six customizable chart widgets, each designed to answer a critical business question:
**Jobs per Technician** answers "How is work distributed across my team?" An imbalanced workload means some techs are overworked (leading to burnout and mistakes) while others are underutilized (costing you money). This chart makes imbalances immediately visible.
**Jobs per Source** answers "Where are my customers coming from?" If you're spending $2,000/month on Google Ads but most of your jobs come from Yelp referrals, that's a budget reallocation opportunity you need to know about.
**Jobs by Status** answers "What does my current pipeline look like?" A healthy business has a steady flow through Open → Appointment → Closed. If jobs are piling up in "Follow Up" status, you have a conversion problem.
**Jobs per Job Type** answers "What type of work am I doing most?" For contractors who offer multiple services, this reveals which services drive volume. An HVAC company might discover that maintenance contracts generate 60% of their jobs but only 20% of revenue.
**Closing Amount per Technician** answers "Who generates the most revenue?" This goes beyond job count to show dollar value. A tech who closes 10 jobs worth $10,000 total is more valuable than one who closes 20 jobs worth $5,000.
**Cancels per Technician** answers "Where am I losing business?" High cancellation rates for a specific tech could indicate customer service issues, scheduling problems, or mismatched skill levels.
Each widget updates in real time based on your selected date filter, and every chart can be clicked to expand into a full-size detailed view.
Drag-and-Drop Customization
Every contractor's priorities are different. An HVAC company might care most about revenue per technician, while a plumbing business might prioritize jobs per source to optimize their marketing spend.
iProDash lets you drag and drop the six dashboard widgets into any order you prefer. Just grab a widget by its handle and move it to a new position. Your custom layout is automatically saved and persists across sessions and devices.
This might sound like a small feature, but it matters more than you'd think. The first widget you see when you open your dashboard sets the tone for your entire day. If revenue tracking is your top priority, put Closing Amount per Technician in the first position. If you're focused on team performance, lead with Jobs per Technician.
The three-per-row layout keeps everything visible without scrolling on desktop screens, while the responsive design automatically adjusts to two columns on tablets and single column on phones.
For contractors who use their CRM dashboard as their morning "cockpit view," this customization ensures the most important information is front and center every time they log in.

Powerful Date Filtering for Period Comparison
Data without context is just numbers. To make meaningful business decisions, contractors need to compare performance across time periods — this week vs. last week, this month vs. last month, this quarter vs. last year.
iProDash's date filtering system makes this effortless. Quick range presets let you select Today, Yesterday, This Week, Last Week, This Month, or Last Month with a single click. Custom date ranges let you define any start and end date for more specific analysis.
When you apply a date filter, every element on the dashboard updates instantly — summary cards, all six chart widgets, and the underlying data. This real-time filtering means you can quickly flip between time periods to spot trends and anomalies.
For example, a contractor might check This Month vs. Last Month to see if job volume is trending up or down. They might compare This Week to the same week last year to account for seasonal patterns. An HVAC contractor knows that July in Arizona will always be busier than January, but comparing July-to-July reveals whether the business is actually growing.
Five summary cards at the top of the dashboard provide the big-picture numbers: Total Technicians, Total Jobs, Total Revenue, Total Tech Profit, and Total Company Profit. Each card links to its detailed view for deeper exploration.
This combination of summary metrics and detailed analytics gives contractors everything they need to understand their business performance — without requiring a business analyst or accountant to interpret the data.
Making Data-Driven Decisions That Grow Your Business
The true value of analytics isn't in the charts themselves — it's in the decisions they enable. Here are real examples of how contractors use iProDash analytics to improve their businesses:
**Marketing optimization**: A plumbing contractor discovers that Angi leads generate an average job value of $180, while Google Ads leads average $450. They shift budget from Angi to Google Ads and see a 40% increase in revenue per marketing dollar.
**Staffing decisions**: An HVAC company sees that their top technician closes $45,000/month while the average is $25,000. They study what makes the top performer different and build training around those practices.
**Pricing adjustments**: An electrical contractor compares closing amounts across job types and discovers that panel upgrades have a 65% profit margin while outlet installations only deliver 15%. They adjust their pricing and marketing to prioritize higher-margin work.
**Service expansion**: A general contractor notices that "water heater" jobs have increased 300% over the past quarter. They invest in plumbing-specific training and equipment to capture more of this growing demand.
None of these decisions would be possible without accessible, visual analytics. And all of them have a direct impact on revenue and profitability.
For contractors and home services businesses that want to compete in an increasingly data-driven world, iProDash provides the analytics foundation. No spreadsheets required.
Start your free trial today and see your business data come to life on the iProDash analytics dashboard.
---
*Looking for a CRM for contractors? iProDash CRM is purpose-built for home services professionals — HVAC, plumbing, electrical, and more. Start your free trial today.*


